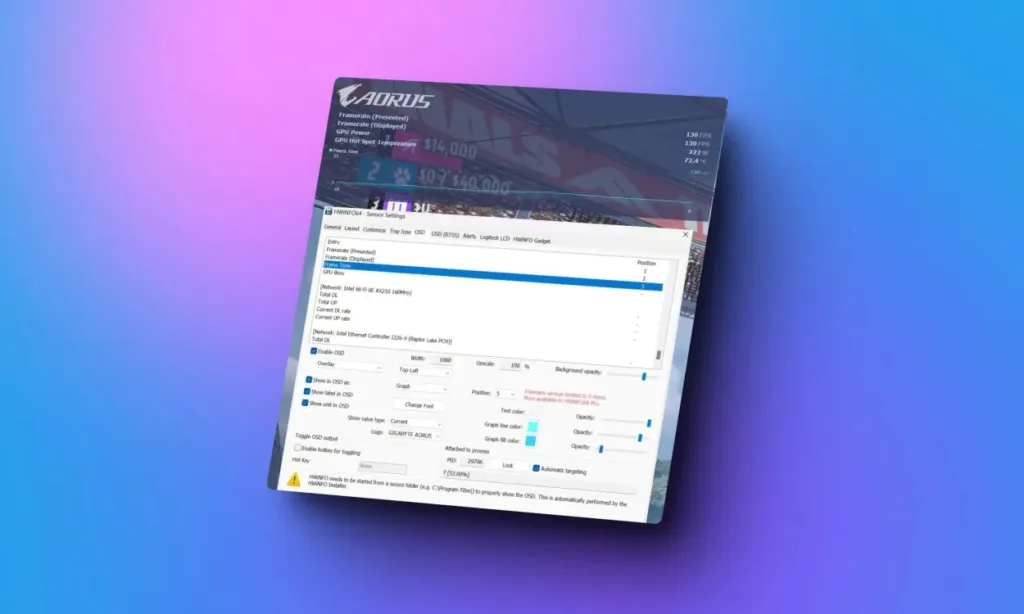
HWiNFO, a widely-used monitoring tool for comprehensive hardware information, is introducing a significant feature called “fully integrated OSD” through its latest v7.73-5370 Beta update. This enhancement makes HWiNFO even more feature-rich, providing users with a straightforward way to view detailed system statistics, including FPS and more, via an overlay.
These statistics are particularly handy for gaming or hardware testing. Throughout my review of Intel’s Core i9 14th Gen and 13th Gen CPUs, I relied on this application to conveniently access system stats. With the new overlay feature, HWiNFO becomes even more beneficial for users like myself. Additionally, for gamers and others interested in monitoring their FPS and system stats, HWiNFO now offers an all-in-one solution.
HWiNFO provides detailed reporting on various system components. For instance, users can monitor the temperatures of their GPU’s core, video memory, and hotspot. Furthermore, the tool allows users to track the specific temperatures of individual CPU cores.
Using HWiNFO’s New Overlay Feature
Although you can access CPU and GPU temperatures through other methods like Task Manager, HWiNFO offers a more advanced solution. To explore its new overlay feature, I downloaded the beta update (visit link). You can do the same, but keep in mind that it’s still in beta, so expect some glitches.
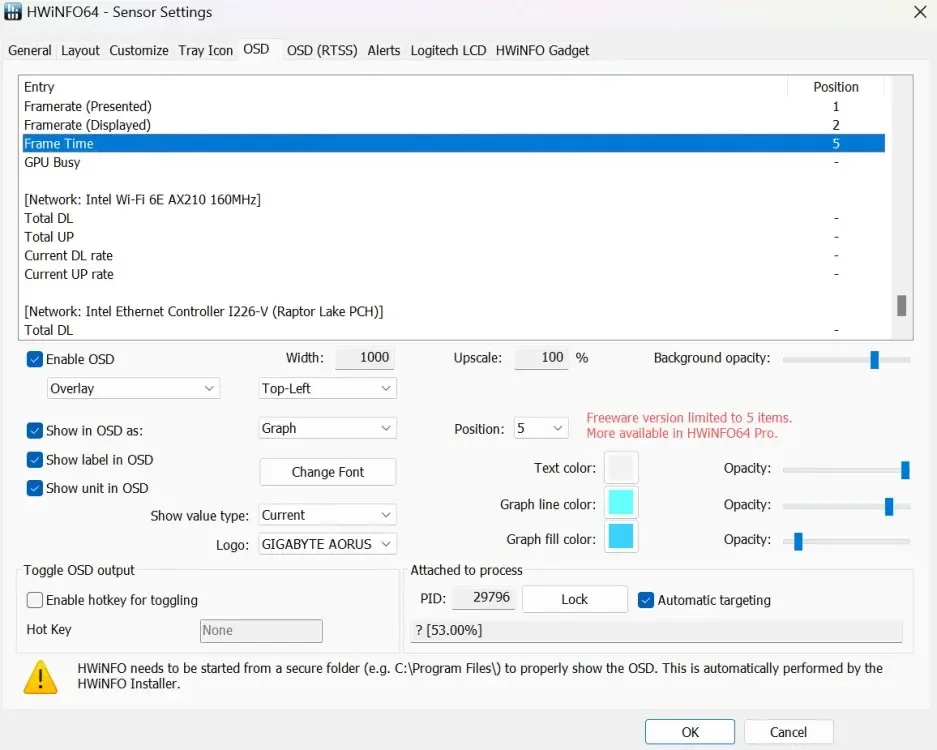
To activate the overlay in HWiNFO, simply launch the application and navigate to Settings -> OSD. Here, select the checkbox next to “Enable OSD,” and you’re all set.
The overlay is highly customizable, allowing you to adjust fonts, colors, and even add graphs or logos. While the HWiNFO OSD can appear as an overlay within your game, you also have the option to display it as a separate window. This option is available under the checkbox for enabling the feature.

How Effective Is HWiNFO’s New Overlay Feature?
I chose specific statistics related to PresentMon, providing real-time FPS data. Additionally, I configured a graph to display frame time, a crucial metric for assessing smoothness. I also included GPU hotspot temperature and power consumption statistics in the overlay.
Next, I launched one of my favorite new multiplayer games, The Finals, renowned for its destruction technology and visually stunning graphics. In this game, FPS often drops during intense moments of destruction. Hence, having real-time FPS monitoring is essential for optimizing gameplay. Moreover, it’s crucial to keep an eye on GPU temperatures to prevent overheating while gaming.

The HWiNFO overlay functions accurately, displaying the desired system statistics effectively. However, during testing, I encountered a caveat with the new overlay feature.
In the free version, the overlay is restricted to displaying only five items. This limitation means that users seeking more comprehensive system monitoring will need to upgrade to the paid ‘Pro’ version. Unlike HWiNFO, using MSI Afterburner with RivaTuner does not impose such restrictions. While many users may not require more than five statistics in the overlay, advanced users may find this limitation restrictive unless they opt for HWiNFO Pro.
The Pro version is priced at $29 for one year, with discounts available for multi-year subscriptions. Alternatively, users can opt for a lifetime license priced at $129.
Essentially, the Pro version caters to advanced users seeking the full capabilities of HWiNFO’s statistics and overlay feature. However, for the average user, the Pro version may not justify the cost, especially considering the availability of free alternatives in the market.
Nevertheless, the addition of the overlay feature in HWiNFO is a welcome development for users interested in monitoring their system statistics. Despite the limitation of five items in the OSD, the HWiNFO overlay feature performs well and should meet the needs of most users.
What are your thoughts on HWiNFO’s new overlay feature? Share your opinions in the comments below!

0 Comments